
Homeownership Market
(Note: This page is part of the 2025 Housing Snapshot report)
Ownership Vacancy
The vacancy rate for owner-occupied homes was last in the “healthy” range in 2016, and has remained at a low rate of 0.6% since 2021. This means that at any given time, only one of 166 homes is vacant. This vacancy rate is lower than the national average, reflecting continued growth in median and high-income households and increased competition to purchase homes.

View Figure Data
| Year | Madison Vacancy Rate | U.S. Vacancy Rate |
|---|---|---|
| 2015 | 2.1% | N/A |
| 2016 | 1.9% | N/A |
| 2017 | 1.4% | N/A |
| 2018 | 1.3% | 1.5% |
| 2019 | 0.9% | 1.3% |
| 2020 | 0.7% | 0.9% |
| 2021 | 0.6% | 0.9% |
| 2022 | 0.6% | 0.8% |
| 2023 | 0.6% | 0.7% |
| 2024 | N/A | 0.9% |
| 2025 | N/A | 1.1% |
| Average | 1.39% | 1.01% |
Sources: ACS 5-Year Estimates (2015–2023), Table DP04; U.S. Census Quarterly Residential Vacancies & Homeownership, 2nd Quarter (2018–2025)
-
Inventory
The July 2025 housing inventory was half that of July 2015, with 2023 as the lowest year.
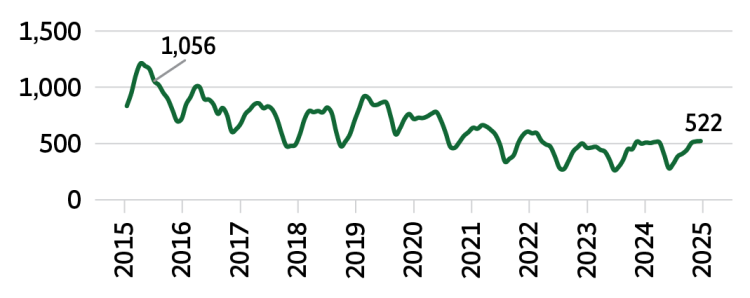
Inventory of Homes for Sale, 2015-2025 -
Sale to List Price Ratio
The comparison of sales price to listing price, which indicates accepted offers vs. what the seller is asking, has risen above 100% (often considered “a seller’s market”), showing a July 2021 peak of 104.7%.

Sale to List Price Ratio, 2015-2025 -
Months Supply
The number of months of supply is essentially flat, which means that if no new homes were listed for sale, it would take two months for all homes to sell (this is below healthy levels of 3–6 months of supply).

Months Supply, 2015-2025 -
Days on Market
The average number of days homes were “on the market” (actively listed for sale) decreased from 60 to 42, reaching a low of 36 days in July 2023.
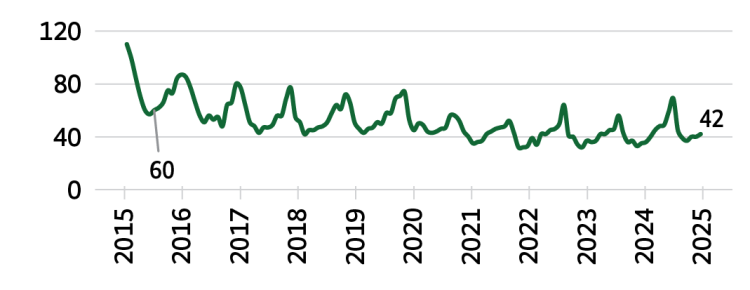
Days on Market, 2015-2025
View Figure Data
| Year | Days on Market | Sale to List Ratio | Months' Supply | Inventory |
|---|---|---|---|---|
| 2015 | 60 | 98.3% | 2.0 | 1,056 |
| 2016 | 56 | 99.7% | 2.1 | 891 |
| 2017 | 47 | 100.4% | 1.9 | 814 |
| 2018 | 47 | 100.5% | 1.7 | 789 |
| 2019 | 47 | 100.6% | 1.8 | 847 |
| 2020 | 44 | 101.2% | 1.7 | 742 |
| 2021 | 37 | 104.7% | 1.5 | 663 |
| 2022 | 34 | 104.0% | 1.6 | 593 |
| 2023 | 36 | 103.1% | 1.6 | 464 |
| 2024 | 36 | 102.3% | 1.7 | 509 |
| 2025 | 42 | 101.1% | 1.9 | 522 |
Source: Redfin monthly housing market data for “all residential” in Madison, WI, downloaded July 2025
Ownership Housing Supply/Demand Comparison
The City of Madison’s market for homeownership is driven by higher-income residents, with 61% of all homeowners making over the median income and just 1 in 4 homeowners making less than 80% AMI. In a competitive “sellers’ market,” lower-income buyers are generally at a disadvantage, as higher-income buyers are perceived as “safer” by sellers due to favorable financing, larger down payments, or fewer contingencies that could delay a sale.
Very few low- and moderate-income households qualify for mortgages based on their incomes, and most (4,030, 59%) of the 6,845 homeowners making under 50% AMI include one or more people over the age of 62, which suggests that many may still own homes they purchased and paid off a long time ago when their incomes were higher. Still, ¾ of these homeowners are housing cost burdened, paying more than 30% of their income on housing.

View Figure Data
| Household Income | <50% AMI Homes | 50-80% AMI Homes | 80-100% AMI Homes | >100% AMI Homes | Total by Income Level |
|---|---|---|---|---|---|
| <30% AMI | 1,115 | 1,125 | 490 | 480 | 3,210 |
| 30-50% AMI | 1,540 | 935 | 740 | 390 | 3,605 |
| 50-80% AMI | 2,720 | 3,645 | 890 | 700 | 7,955 |
| 80-100% AMI | 1,915 | 3,105 | 1,040 | 925 | 6,985 |
| >100% AMI | 3,410 | 12,765 | 7,875 | 9,950 | 34,000 |
| Total by Affordability Level | 10,700 | 21,575 | 11,035 | 12,445 | 55,755 |
Source: HUD CHAS 5-Year Estimates (2017–2021) for Madison, WI, Table 1 (Owners) & Tables 15A & B (Ownership Unit Affordability)
We see pressure on moderate-income households when higher-income households compete for fewer available homes. As with the rental market, many higher-income households choose to buy or retain homes very affordable for them (as a percentage of income), increasing challenges for potential homebuyers with lower incomes.
71% of homeowners above Madison’s median income and 59% of all homeowners live in homes that would be affordable to households in lower income brackets.

View Figure Data
| Household Income | Homeowners with this income | Owner-occupied homes affordable to this income | Surplus/Deficit |
|---|---|---|---|
| <50% AMI | 6,845 | 10,695 | +3,850 |
| 50-80% AMI | 7,970 | 21,570 | +13,600 |
| 80-100% AMI | 6,985 | 11,040 | +4,055 |
| >100% AMI | 34,060 | 12,450 | -21,610 |
Home Costs and Purchasing Power
A blend of home value data and city median income for 2-person households suggests that households have far less purchasing power today than in 2015. Home costs rose just slightly faster than purchasing power until 2021, when we see a dramatic drop in purchasing power associated with a spike in interest rates.

View Figure Data
| Year | "Top Tier" Home Value | "Typical" Home Value | "Bottom Tier" Home Value | Median Income, 2-person HH | Affordability Limit, Median Income | Affordability Limit, 80% AMI | Affordability Limit, 50% AMI | 30-Year Mortgage Rate |
|---|---|---|---|---|---|---|---|---|
| 2015 | $335,345 | $225,619 | $146,443 | $69,199 | $277,288 | $221,830 | $138,644 | 4.08% |
| 2016 | $355,839 | $244,297 | $161,064 | $70,914 | $299,814 | $239,851 | $149,907 | 3.41% |
| 2017 | $370,344 | $259,887 | $175,514 | $74,430 | $311,590 | $249,272 | $155,795 | 3.96% |
| 2018 | $389,030 | $276,244 | $190,305 | $77,946 | $323,365 | $258,692 | $161,683 | 4.52% |
| 2019 | $397,967 | $286,373 | $200,880 | $81,462 | $335,141 | $268,113 | $167,571 | 3.75% |
| 2020 | $413,729 | $301,838 | $214,078 | $85,367 | $372,146 | $297,717 | $186,073 | 3.03% |
| 2021 | $463,733 | $343,976 | $245,855 | $89,760 | $392,881 | $314,305 | $196,441 | 2.98% |
| 2022 | $508,396 | $378,405 | $270,567 | $96,327 | $350,693 | $280,554 | $175,347 | 5.30% |
| 2023 | $527,650 | $394,849 | $282,976 | $98,205 | $319,075 | $255,260 | $159,538 | 6.81% |
| 2024 | $556,052 | $418,765 | $299,247 | $107,620 | $345,779 | $276,623 | $172,890 | 6.95% |
| 2025 | $622,048 | $427,751 | $310,811 | N/A | N/A | N/A | N/A | 6.67% |
Sources and Methodology: Zillow Average Home Values by “Tier” for July, 2015-2025); ACS 5-Year Estimates 2015-2023, Table B19019; ACS 1-Year Estimate, 2024, Table B19019; Calculator.net; Freddie Mac Average Annual Interest Rates for 30-Year Mortgage (20% Downpayment); City of Madison Assessor, 2025 Mill Rate of 1.86% for property in City of Madison and Madison Metropolitan School District applied to all years
Homeownership Rates by Age
Homeownership rates by age appear almost flat over the past decade, but there is a notable decline in homeownership among younger households. Households under 35 are Madison’s fastest-growing age cohort, and the only group for which the homeownership rate significantly declined. Since 2015, this age group grew by more than 9,500 households, yet the number of homeowners within the group grew by only 124 (1.3%).

View Figure Data
| Year | Households Age <35 | Households Age 35-64 | Households Age 65+ | Homeownership Rate, Age <35 | Homeownership Rate, Age 35-64 | Homeownership Rate, Age 65+ |
|---|---|---|---|---|---|---|
| 2015 | 40,386 | 47,255 | 16,550 | 19% | 64% | 71% |
| 2016 | 41,469 | 46,970 | 17,244 | 19% | 64% | 72% |
| 2017 | 42,749 | 47,049 | 18,092 | 19% | 64% | 72% |
| 2018 | 42,973 | 46,984 | 18,616 | 18% | 63% | 72% |
| 2019 | 43,671 | 47,453 | 19,170 | 18% | 63% | 73% |
| 2020 | 43,464 | 47,749 | 20,619 | 18% | 64% | 74% |
| 2021 | 45,478 | 49,858 | 21,988 | 17% | 64% | 73% |
| 2022 | 47,171 | 50,380 | 22,958 | 16% | 64% | 74% |
| 2023 | 49,948 | 52,494 | 23,345 | 16% | 64% | 74% |
| Change | 9,438 | 5,239 | 6,795 | -3% | 0% | +3% |
Source: ACS 5-Year Estimates (2015–2023), Table S2502
Starter Homes and Younger Households
Available data from ACS and Zillow allow a comparison between the value of housing types often considered “starter homes” and the housing price affordable to younger households (ages 25–44) most likely to be first-time homebuyers.
It is clear the post-pandemic spike in interest rates significantly impacted the price households can afford. Though competition among homebuyers was already strong, the incomes of younger households before 2021 were sufficient to afford home purchases at prices about $100,000 above the average value.
Income estimates in 2023 show a dramatic decline in the home price affordable to younger households dropping to $284,000, similar to the average starter home values. Current interest rates will continue to make it more difficult for first-time homebuyers in this already tight market.

Homeownership Rates by Race
Homeownership rates in Madison vary greatly by race.
Since 2015, homeownership rates for Asian, Black, or Hispanic/Latino householders have all risen, with Hispanic/Latino households rising most significantly by 8 percentage points to 35%.
As of 2023, over half of White non-Hispanic/Latino households own their homes, but only 1 in 3 Asian households, 1 in 3 Hispanic/Latino, and 1 in 5 Black households were homeowners. These numbers suggest slight trends toward more equitable homeownership by race, but racial disparities, particularly between White and Black households, remain at unacceptable levels.

View Figure Data
| Year | Asian | Black | Hispanic/Latino | White Non-Hispanic |
|---|---|---|---|---|
| 2015 | 32% | 19% | 27% | 53% |
| 2016 | 33% | 14% | 28% | 53% |
| 2017 | 30% | 19% | 30% | 52% |
| 2018 | 27% | 15% | 33% | 52% |
| 2019 | 29% | 15% | 30% | 53% |
| 2020 | 31% | 15% | 35% | 53% |
| 2021 | 32% | 28% | 35% | 53% |
| 2022 | 31% | 17% | 32% | 52% |
| 2023 | 33% | 21% | 35% | 52% |
| % Change | +1% | +2% | +8% | -1% |
Source: ACS 5-Year Estimates (2015–2023), Table S2502