
New Housing Completions Surpass 2025 Total
With three months left in 2026, more housing has been completed Madison this year than all of 2025.
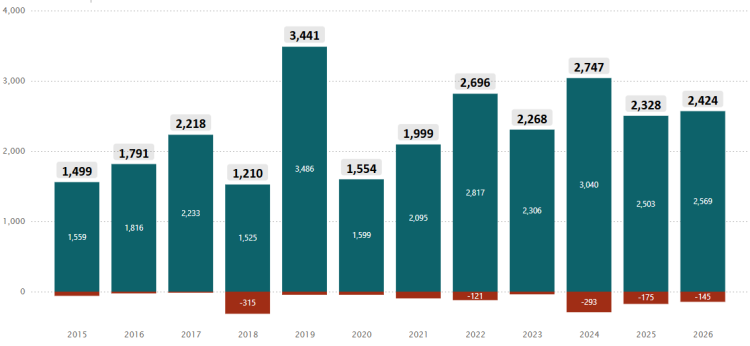
The latest update to the City of Madison Housing Tracker shows a total of 2,424 net new homes of all types have been completed through September 30, 2026, compared to 2,328 net new homes completed in all of 2025. The most net new homes completed in a single year based on available data was 3,441 in 2019.
Show Graph Data
| Year | Total New Homes Completed | Homes Demolished | Net New Homes |
|---|---|---|---|
| 2026 (through 9/30) | 2,569 | 145 | 2,424 |
| 2025 | 2,503 | 175 | 2,328 |
| 2024 | 3,040 | 293 | 2,747 |
| 2023 | 2,306 | 38 | 2,268 |
| 2022 | 2,817 | 121 | 2,696 |
| 2021 | 2,095 | 96 | 1,999 |
| 2020 | 1,599 | 45 | 1,554 |
| 2019 | 3,486 | 45 | 3,441 |
| 2018 | 1,525 | 315 | 1,210 |
| 2017 | 2,233 | 15 | 2,218 |
| 2016 | 1,816 | 25 | 1,791 |
| 2015 | 1,559 | 60 | 1,499 |
Net new homes accounts for total new homes created minus demolitions, which are sometimes necessary for infill development. The Housing Tracker considers each individual dwelling unit – whether it is a single-family home, a duplex, or an apartment unit and whether it is rented or owned – as a home.
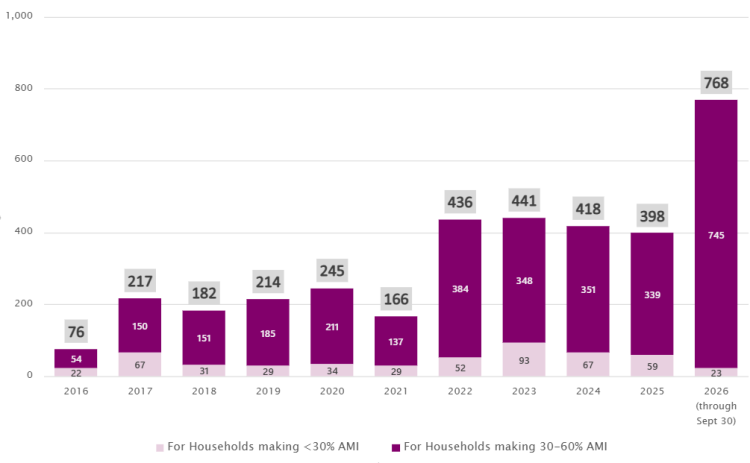
Of the 2,424 net new homes completed so far in 2025, 768 (more than 31.5% of this year's total homes completed) are subsidized affordable homes reserved for those making 60% or less of the Area Median Income (AMI) as defined by the Wisconsin Housing and Economic Development Authority (WHEDA). The 768 affordable homes completed so far this year are the most in a single year dating back to 2016 and nearly doubles last year's total of 398 new affordable homes.
Show Graph Data
| Year | Homes for <30% AMI | Homes for 30-60% AMI | Total Affordable Homes Completed |
|---|---|---|---|
| 2026 (through 9/30) | 23 | 745 | 768 |
| 2025 | 59 | 339 | 398 |
| 2024 | 67 | 351 | 418 |
| 2023 | 93 | 348 | 436 |
| 2022 | 52 | 384 | 436 |
| 2021 | 29 | 137 | 166 |
| 2020 | 34 | 211 | 245 |
| 2019 | 29 | 185 | 214 |
| 2018 | 31 | 151 | 182 |
| 2017 | 67 | 150 | 217 |
| 2016 | 22 | 54 | 76 |
The Housing Tracker was launched in January 2025 as a way to publicly show the progress being made toward the City of Madison's goal of seeing 15,000 new homes created by 2030, with 25% of those offering long-term affordability, to account for projected population growth. There were approximately 134,800 households in Madison at the start of 2025, with City staff projecting another 9,300 households (containing approximately 18,400 people) moving to Madison by 2030. For the purposes of the Housing Tracker, we consider a home "under construction" once it receives its building permit and "completed" once it receives its certificate of occupancy.
With the latest update to the Housing Tracker data, the City of Madison is 32% of the way to its goal of seeing 15,000 new homes added by 2030, with 4,750 new homes being completed since the start of 2025. Another 4,416 new homes are currently under construction.
ADUs Added to Housing Tracker
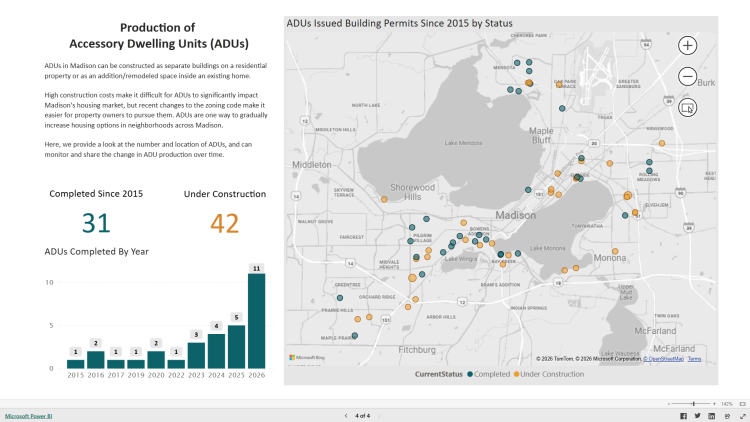
New with the October 1, 2026, data update, the Housing Tracker is now able to follow the creation of Accessory Dwelling Units (ADUs) across Madison. This new addition can be found on Page 4 of the Housing Tracker, with data dating back to 2015 and a map showing where they are located.
Show Graph Data
Year | ADUs Completed |
|---|---|
2015 | 1 |
2016 | 2 |
2017 | 1 |
2018 | 0 |
2019 | 1 |
2020 | 2 |
2021 | 0 |
2022 | 1 |
2023 | 3 |
2024 | 4 |
2025 | 5 |
2026 | 11 |
Do we really need this much housing?
Yes. More than 2,000 new housing units are needed every year just to keep up with the number of new households coming to Madison, and that does not address the backlog of new homes needed to address low vacancy rates that drive up the cost of housing. Hundreds of additional housing units beyond that baseline of 2,000 per year need to be built just to begin to slow housing cost increases and improve vacancy rates.
Data over the last two decades show that slower housing production does not slow population growth, household creation, or in-migration. During the 13-year period between 2006 and 2019 (after which housing production began increasing), approximately 19,000 housing units were built in Madison, while the number of households increased over by 24,000.
Slow housing growth and consistent population growth places the burden of the tight housing market on the city's lowest-income households, who cannot compete with higher earners who could otherwise afford newly constructed housing, but end up paying higher rents for established, naturally occurring affordable housing.
What is considered “affordable housing?"
What someone considers “affordable housing" can vary by household size and income, but when the City of Madison references affordable housing, it uses the standards set by the Wisconsin Housing and Economic Development Authority (WHEDA), which produces updated calculations every year based on the Area Median Income (AMI) for each county across the state.
Under those standards, “affordable housing" is generally considered a home that would cost a renter making 60% of the AMI or a homeowner making 80% of the AMI no more than 30% their monthly income.
To put that definition into dollars and cents: Dane County's Median Area Income in 2026 is $94,800 for a single-person household or $135,300 for a four-person household – meaning 60% of Dane County's AMI would translate to $56,880 for a single-person household or $81,180 for a four-person household. Households making up to 60% AMI would likely qualify for most of the affordable housing that received City subsidies (whether through the Affordable Housing Fund or TIF).
The Housing Tracker counts the number of affordable homes created that received those subsidies. There are additional affordable housing opportunities across Madison that did not receive City subsidies, but City staff generally do not have access to that data.
What is Area Median Income?
Area Median Income measures the median – meaning the middle, not the average – of the salary range for an area. Using the median income – with half of the people in the area making more, and half of the people in the area making less – provides a more accurate picture of the midpoint of incomes in an area, since an average may be skewed by extremely high or extremely low incomes.
| AMI | 1 Person Household | 2 Person Household | 3 Person Household | 4 Person Household |
|---|---|---|---|---|
| 30% | $28,440 | $32,490 | $36,540 | $40,590 |
| 40% | $37,920 | $43,320 | $48,720 | $54,120 |
| 50% | $47,400 | $54,150 | $60,900 | $67,650 |
| 60% | $56,880 | $64,980 | $73,080 | $81,180 |
| 70% | $66,360 | $75,810 | $85,260 | $94,710 |
| 80% | $75,840 | $86,640 | $97,440 | $108,240 |
| 100% | $94,800 | $108,300 | $121,800 | $135,300 |